

BTC/USD
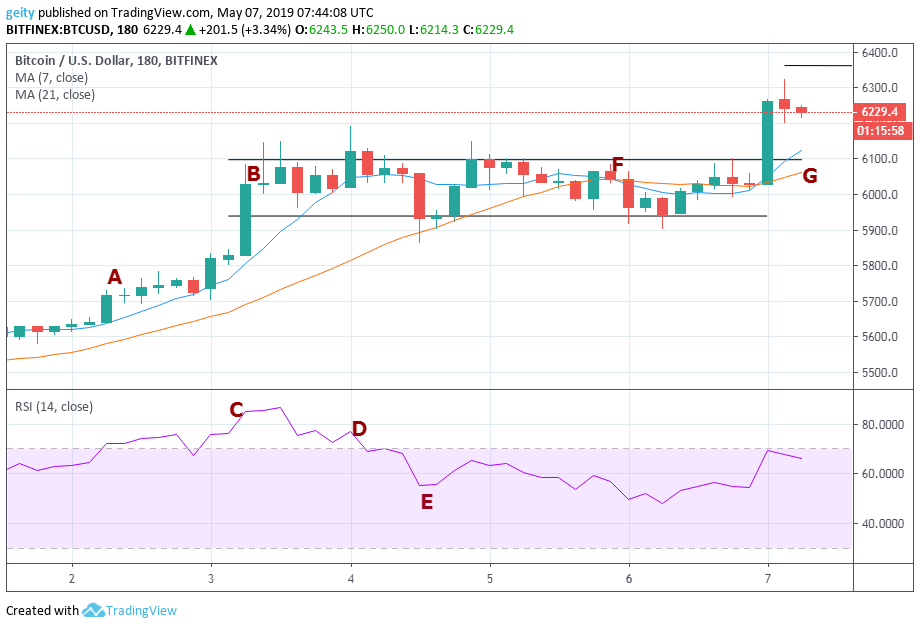
A bull run is seen in the last 24h. The day started with a bullish market rally when the BTC was trading at $5645 (A) and pushed up its momentum to trade at $5,940 (B).
At around May 3rd and 4th (C and D), the relative strength index was above 70 indicating overbought in the market but later on dip to 55 (E). After the engulfing pattern at (B) consolidation followed as the price momentum was sought, thus resulted in a ranging trend placing the resistance level at $6095 and support level at $5940.
Around may, 5th (F) the 21-day moving average crossover the 7-day moving average thus indicates a bearish trend, after few hours at (G) the 7 day MA crossover 21 day MA resulting into a bullish momentum. The BTCUSD pair started trading at $5718 and is currently trading at $5,984 thus increasing the trading rate at 4.85%. Increase in price led to increasing sell out by investors.
FORECAST
The RSI is pointing south which indicates a dip in price. Targets can be placed at 6100.
LTC/USD
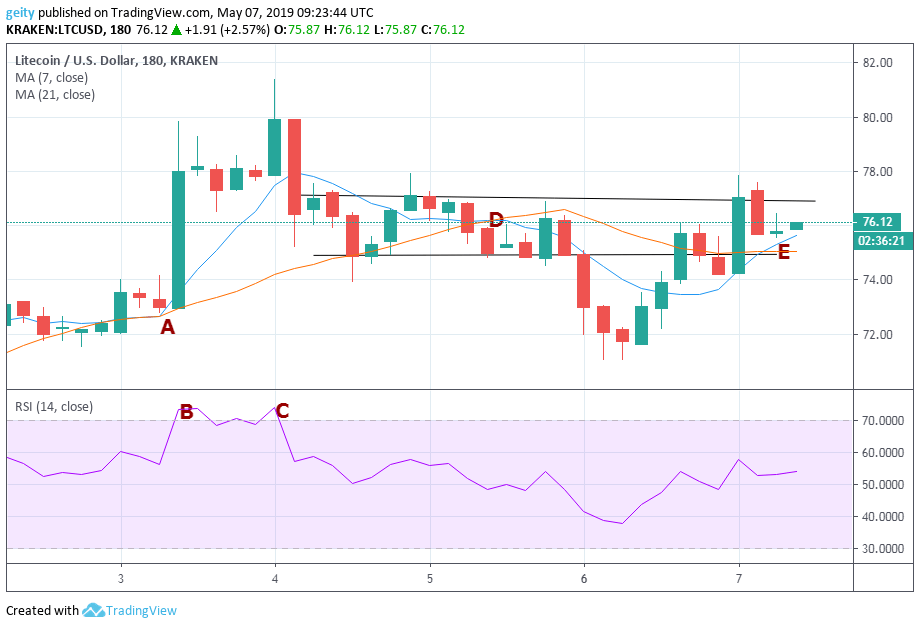
A sideways trend is seen in the last 24hrs, placing resistance level at $76.87 and support level at $74.94. The LTC/USD is currently trading at $76.12, therefore, has a price increase rate of 2.78%.
The day started with indecision in the market but later on, the 7day moving average was dominantly above 21 day moving average which resulted to a bullish engulfing pattern that pushes the price up to USD $78.01, making the point (A) a better place to place an entry.
The market was overbought between point B and C since the RSI indicator was above 70 thus resulted to increase in price momentum making it settle at $79.98. Later on, the 21 days MA crossed over the 7 day MA at (D) which resulted to decrease in price momentum. This was then followed by a reversal where the price pulls back up.
FORECAST
Currently, the 7-day moving average has crossover 21 days moving average and the RSI is between the levels of 40 and 60. This may mean that the market is most likely going to be range bound.
EOS/USD
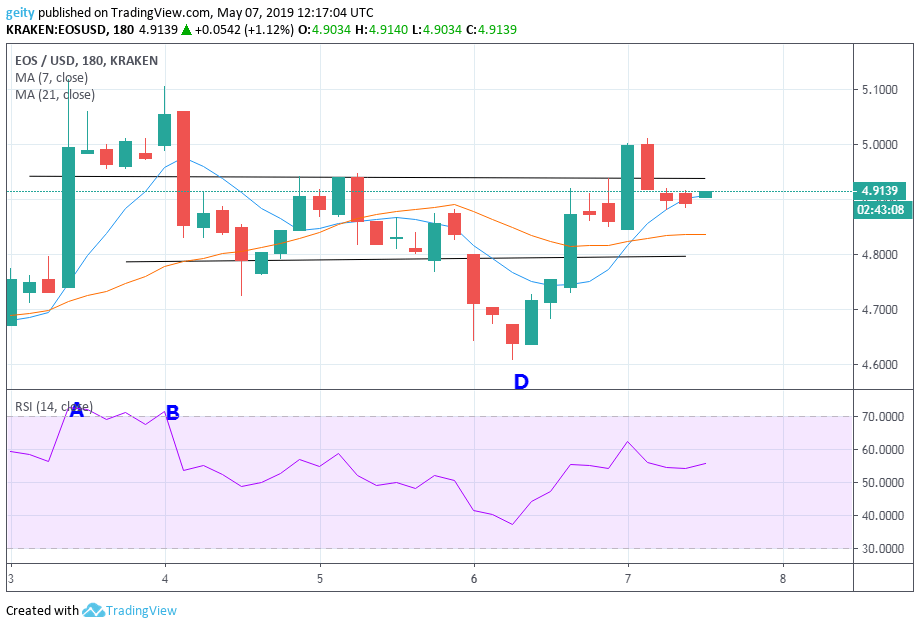
A bullish outlook is observed in the last 24hrs, the price momentum of the EOS is up by 4.02% having begun trading at $4.6721 against the current rate of $4.9137.
The market is ranging, thus a sideways trend is seen, placing resistance level at $4.938 and support level at $4.80. The RSI shows overbought of the market at (A) and (B). This was then followed by a downtrend later on.
FORECAST
The 7 day MA is dominantly above 21 day MA during the last few hours thus signals an increase of price momentum in the coming days. We can expect that the price should breach the $4.9 barrier as it targets $5.0.
http://platform.twitter.com/widgets.js


Be the first to comment