

1-day BTC chart
The largest cryptocurrency by market cap, Bitcoin held a market cap of $111.8 billion and climbed to $6,707 after posting a rally of 6.97% over the past 24 hours. At press time, the crypto-asset on CoinMarketCap recorded a 24-hour trading volume of $18.6 billion. Additionally, BTC registered a significant 15.51% increase in its price over the past week.
Source: TradingView
The one-day BTC chart registered a significant uptrend from $4,143 to $5,153 and another uptrend from $5,143 to $5,740, catapulted by the latest sprint. A downtrend from $6,321 to $5,542 was also observed on the chart.
BTC broke the previous set resistance at $6,500 in a very short period of time. Bitcoin was anticipated to break the resistance points at $7,000. The support for the chart stood firm at $3,859.
Bollinger Bands: The open mouth of the bands indicated high price volatility and another price break out for Bitcoin.
Awesome Oscillator: The closing bar of the indicator was green, suggesting some bullish activity for the coin.
Chaikin Money Flow: The CMF was also above the zero-line, indicating that money was flowing into the coin market. Hence, a bullish price pattern for the crypto-asset was recorded.
1-day LTC chart
Litecoin held a market cap of $4.83 billion. The coin was mildly bullish and was priced at $78.29 after a rise of 3.23% over the past 24 hours. At press time, the fifth largest coin on CoinMarketCap recorded a 24-hour trading volume of $3.07 billion.
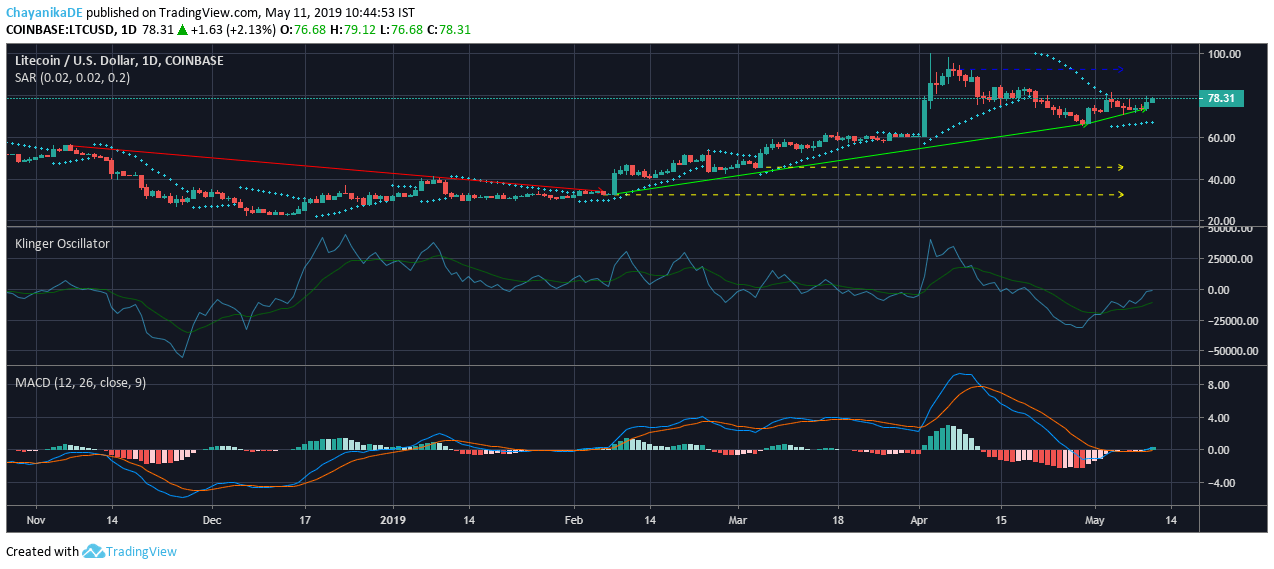
Source: TradingView
The one-day Litecoin [LTC] chart registered an uptrend from $32.86 to $66.76 and another uptrend from $66.76 to $73.80, following market correction. A downtrend from $55.96 to $33.80 was also observed. Unlike its gold counterpart, Litecoin failed to break the immediate resistances and was trading below $80. The immediate resistance point was found at $92.30 and the supports for the chart stood at $45.04 and $32.62.
Parabolic SAR: The dotted markers were below the candlesticks, indicating a bullish phase for the crypto-asset.
Klinger Oscillator: The reading line was also above the signal line, pointing towards a bullish price pattern for Litecoin.
MACD: The MACD line was also above the signal line, indicating the coin following a bullish course.
Conclusion
Bitcoin broke the major resistances and is anticipated to climb higher with strong signs of potential price breakout in the near term, while Litecoin was trading at a slow pace, chasing the $80-level.


Be the first to comment