

- Litecoin has sustained growth above a long-term trend line since December 2018.
- Litecoin does not have a shortage of support levels.
In spite of the correction the high traded in April this year, Litecoin has sustained growth above a long-term trend line that has been forming since the lows of December at $22.58. Besides, the price is above the 100 SMA the 100 Simple Moving Average (SMA) daily chart.
LTC/USD daily chart
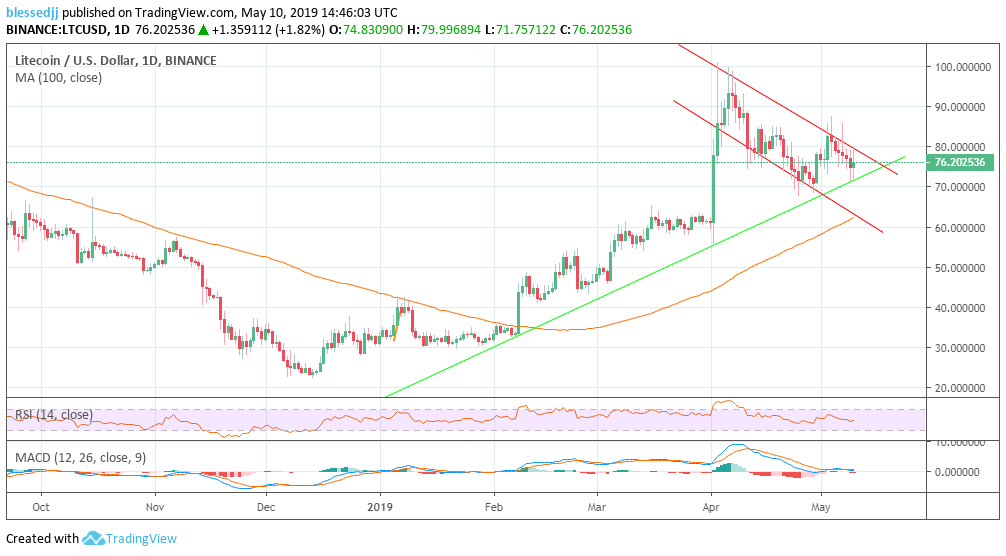
Following the surge in the first week of April, Litecoin explored the levels close to $100 but the trend reversed. Moreover, the asset has not been able to recover its lost glory instead we see we have witnessed a break below $80.00 and even the main support at $70.00. The ascending trendline has been very instrumental in stopping declines over the past five months.
A correction from $70.00 support has stepped above $80.00 and formed May highs at $87.27 (on Coinbase) before bearish pressure kick in again. The daily chart shows a building bullish momentum at $76.34 (current value). The price is grinding closer to a bullish flag pattern breakout that is likely to open the door for a correction to highs around $90.00 and eventually reach out to levels close to $100. A bullish flag pattern is considered a continuation pattern. It indicates that the trend before the pattern formed is likely to form following a resistance breakout.
Also Read: Binance Coin [BNB] Slips To Further $18 While Bitcoin Enjoys Momentum
The first resistance is $80.00 (price resistance congestion). The second hurdle is at May highs around $87.27. $90.00 will also limit growth to the upside while $100 is the ultimate medium-term resistance level.
Litecoin does not have a shortage of support levels either with $70.00 bring the initial vital support. $60.00 is the second support congestion zone whole $40 is the third key support area.
Litecoin Key Technical Picture
100 SMA daily chart: $62.39
MACD daily chart: +0.6949
RSI daily chart: 50.3626 (trending up).
![Litecoin [LTC] Price Analysis: Impending Bullish Flag Pattern Breakout](../../../cdn.coingape.com/wp-content/uploads/2019/01/25231242/litecoin.jpg)
Article Name
Litecoin [LTC] Price Analysis: Impending Bullish Flag Pattern Breakout
Description
Litecoin has sustained growth above a long-term trend line since December 2018.
Litecoin does not have a shortage of support levels.
Author
John isige
coingape
Publisher Logo


Be the first to comment