

- ETH at risk of falling into trap of rising wedge.
- Long term stability only after $200-250 range decisively crossed.
Ethereum, the second largest cryptocurreny by market capitalisation has doubled from its December 2018 lows and is technically way past the definition of bull run, but given the set up it is in, there is every likelyhood it may fall trap of a rising wedge on the long term chart, unless it decisively crosses and sustains above a specific range.
ETH/USD is down more than one percent on day at $64.53, near low point of the day. On the 12-hour chart of ETH, it seems to be falling into the trap of a rising wedge, which is potentially bearish for the prices. If the pattern completes and holds true to itself, it can easily halve the prices from the top of the wedge.
While that is a key worry, for the bulls to disregard the pattern, prices first need to sustain above $180. That would be temporarily sufficient, although for long term bull market stability, ETH still needs to cross past the range of $200-250.
ETH/USD 720-minute chart:
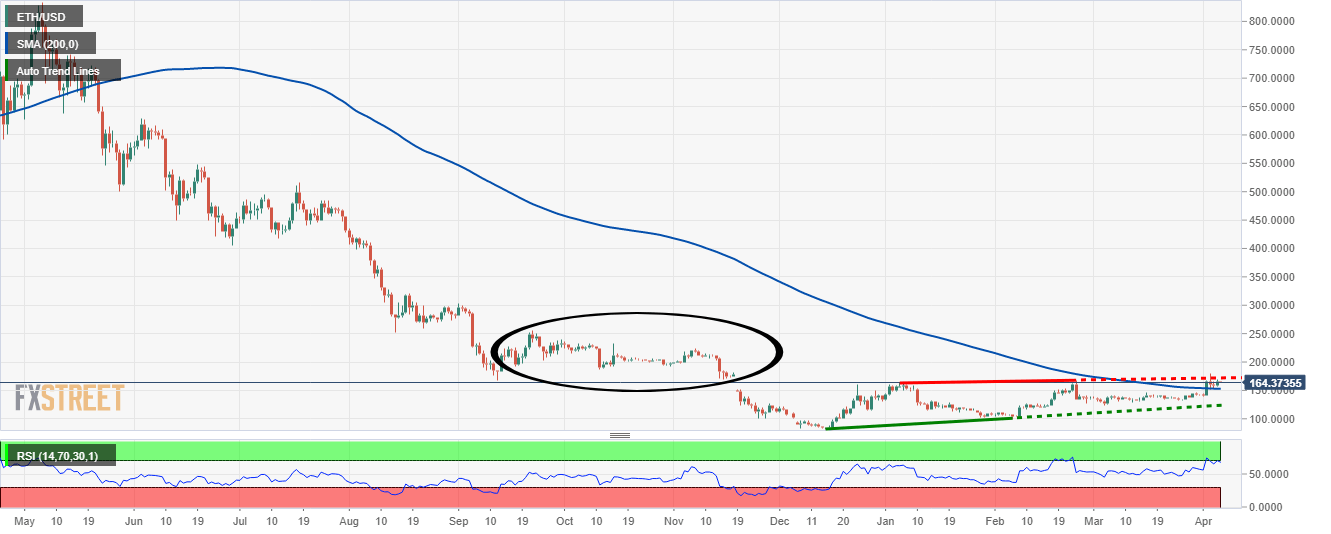
ETH/USD daily chart:
Get 24/7 Crypto updates in our social media channels: Give us a follow at @FXSCrypto and our FXStreet Crypto Trading Telegram channel
http://platform.twitter.com/widgets.js


Be the first to comment