

On the other hand, most altcoins faced a strong selling interest, resulting in bearish moves in binance coin (BNB), Ethereum (ETH), ripple (XRP), bitcoin cash (BCH), litecoin (LTC), stellar (XLM), ADA, EOS, and TRX. There could be a short-term upside correction, but it won’t be easy for the bulls to gain strength.
Read: Top Forex & CFD Brokers
Key Takeaways:
- Bitcoin price declined heavily after trading to a new 2019 near $5,700.
- Ethereum price declined sharply and broke the key $167.20 support area.
- Ripple price settled below the key $0.3120 and $0.3090 support levels.
- EOS price declined sharply after there was a break below the $5.10 support area.
- WAB and OVC surged more than 150% in the past 7 days.
Bitcoin Price Analysis
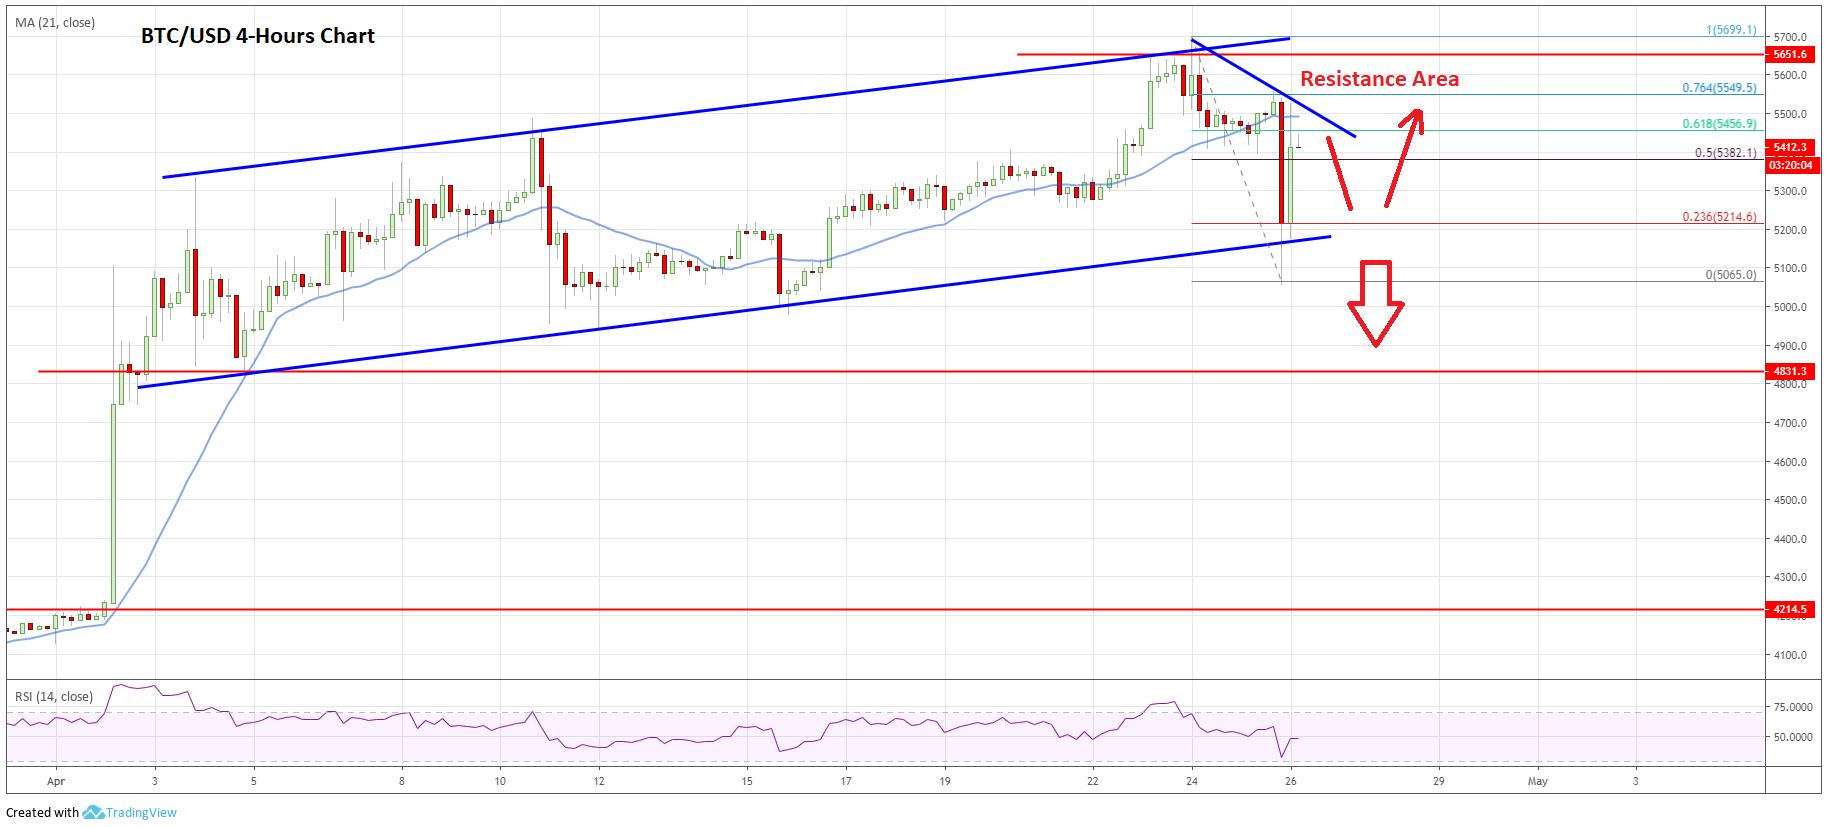
Earlier this week, there was a strong upward move in bitcoin price above the $5,400 and $5,550 resistance levels. BTC even broke the $5,600 level and traded to a new multi-month high near $5,700 before starting a downside correction.
Bitcoin Price Chart: Click to Enlarge
Looking at the 4-hours chart, the price topped near the $5,690 level and later struggled to surpass the $5,650 resistance area. As a result, there was a sharp decline and the price traded below the $5,500 support level and the 21 simple moving average (4-hours).
The decline was such that the price even broke the $5,200 level and spiked below the $5,100 support. A swing low was formed near $5,065 and the price bounced back above an ascending channel with current support at $5,200 on the same chart.
There was a break above the 50% Fib retracement level of the recent decline from the $5,699 high to $5,065 low. However, there is a strong resistance near the $5,480 level plus the 21 simple moving average (4-hours).
Furthermore, the 61.8% Fib retracement level of the recent decline from the $5,699 high to $5,065 low is also acting as a hurdle for buyers. More importantly, the recent bounce in bitcoin is due to Tether’s (USDT) decline.
Therefore, there are chances of a fresh decline below the $5,400 and $5,300 levels in the near term. There is even a risk of a downside break below the channel support at $5,100.
The next main support is at $4,830, where the bulls may take a stand. On the upside, a convincing break above the $5,500 level and the 21 simple moving average (4-hours) is must to start a fresh increase above $5,700 and $5,750.
Ethereum Price Analysis
Ethereum price struggled to follow bitcoin to a new 2019 high as it struggled to break the $178.80 and $180.00 resistance levels. As a result, there was a sharp decline in ETH below the key $167.50 and $165.00 support levels.
Ethereum Price Chart: Click to Enlarge
Looking at the 4-hours chart, the price declined heavily below the $167.50 support and the 21 simple moving average (4-hours). More importantly, there was a break below a crucial contracting triangle with support near the $167.40 level.
The price tumbled below the $160.00 level and traded close to the $149.00 level. A swing low was formed at $148.98 and the price is currently correcting higher.
It broke the 23.6% Fib retracement level of the last decline from the $178.80 high to $148.98 low. However, there are many resistances on the upside near the $167.00 level and the 21 simple moving average (4-hours).
The 50% Fib retracement level of the last decline from the $178.80 high to $148.98 low is also near the $164.00 level to act as a resistance.
To start a decent upward move, the price must break the $167.40 level and the 21 simple moving average (4-hours). The next major resistance is near $176.00 and $176.50.
On the other hand, if the price fails to move above $164.00 or $167.40, there could be a fresh decline. The main support on the downside is at $150.00, below which there is a risk of a drop towards the $135.00 level in the near term.
Ripple Price Analysis
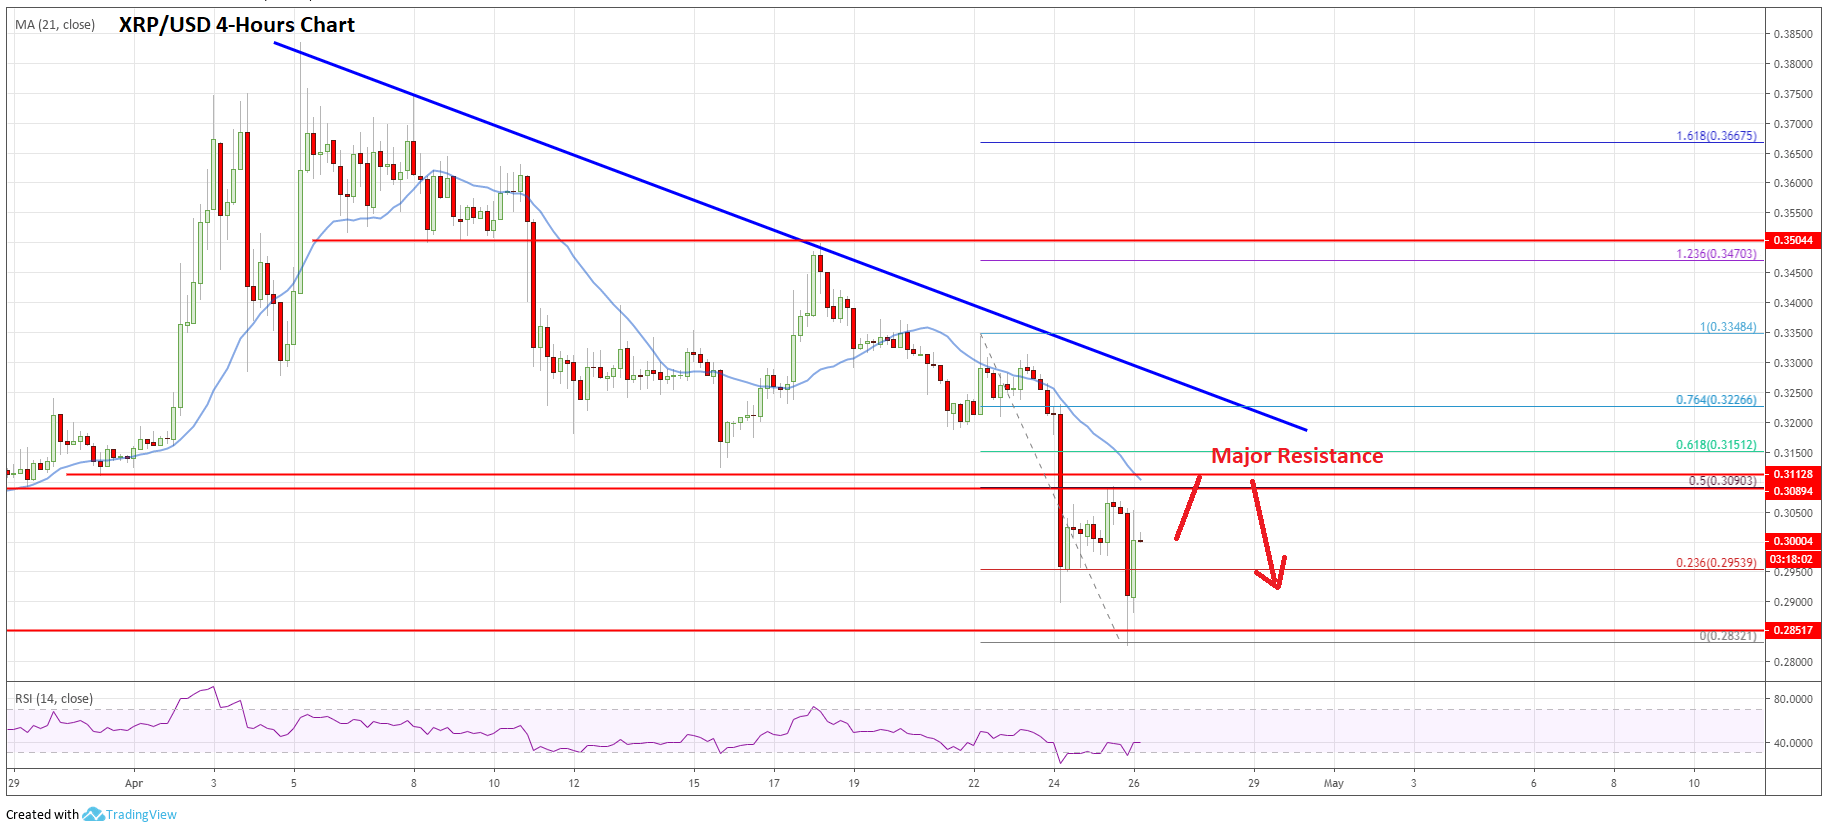
There was an extended decline in ripple price below the $0.3150 support against the US Dollar. XRP/USD remained in a bearish zone and recoveries faced a strong selling interest. The pair recently broke the $0.3120 and $0.3090 support levels to move further into a downtrend.
Ripple Price Chart: Click to Enlarge
Looking at the 4-hours chart, the price settled below the key $0.3090 support and the 21 simple moving average (4-hours). The price even broke the $0.2960 support level and spiked below the $0.2880 level.
A new monthly low was formed at $0.2832 and the price is currently correcting higher. It broke the 23.6% Fib retracement level of the recent drop from the $0.3348 high to $0.2832 low.
However, the previous support area near $0.3090 and the 21 simple moving average (4-hours) are likely to act as a strong barrier for the bulls. The 50% Fib retracement level of the recent drop from the $0.3348 high to $0.2832 low is also near the $0.3090 resistance.
Moreover, there is also a key bearish trend line active with current resistance at $0.3200 on the same chart. Therefore, an upward move towards the $0.3090 or $0.3200 level is likely to face a strong selling interest.
On the downside, an initial support is at $0.2900, below which the price could even break the $0.2840 level and test $0.2800.
EOS Price Analysis
EOS price failed to hold gains above the $5.50 and $5.40 support levels against the US Dollar. The price broke the $5.10 support level to move into a bearish zone and start a downtrend.

EOS Price Chart: Click to Enlarge
Looking at the 4-hours chart, the price settled below the key $5.10 support and the 21 simple moving average (4-hours). The decline was such that the price even cleared the $4.75 support level.
A new monthly low was formed at $4.53 and the price recently corrected higher. It broke the 23.6% Fib retracement level of the last decline from the $5.454 high to $4.536 low.
However, the $5.00 level and the 21 simple moving average (4-hours) are currently acting as resistance. Besides, the 50% Fib retracement level of the last decline from the $5.454 high to $4.536 low is also near the $5.00 level.
On the upside, the main resistance is near the $5.10 level (the previous support) and a connecting bearish trend line on the same chart. A successful close above $5.10 is must to start a significant upward move.
If EOS price fails to move above $5.00 or $5.10, it could retest the $4.60 or $4.50 support levels in the near term.
Top Gainers
During the past 7 days, a few small cap altcoins gained traction and rallies more than 100%, including WAB, OVC, GOD and ZPR (trading volume more than $50K). Out of these, WAB rallied around 230% and OVC gained nearly 155%.
Overall, tether’s (USDT) weakness impacted the market sentiment for bitcoin. If BTC struggles to recover, there are chances of another strong bearish reaction below $5,300 and $5,200. It is already trading in a bearish zone below $5,250 versus the US Dollar, which is a bearish zone. More importantly, altcoins such as Ethereum, ripple, bitcoin cash, litecoin, XLM, ADA, TRX, EOS, ICX, BNB, XMR, WAN, and ICX are already struggling to correct higher.
The market data is provided by TradingView, Bitfinex.
You have Successfully Subscribed!


Be the first to comment